
In this article you will find how to choose the right metrics, what is a ‘good KPI’ and why some metrics don’t speak the language of the business. Article based on a talk.
This article is based on a talk I gave at SwissRe in October 2023. When I was asked by SwissRe’s Digital Media Team to present SEO data, I did not know where to start. I wondered what would be most useful for the team. I believe that data is a common language, so I focused my talk on giving some guidance on how to select data and how to communicate with data. I use examples of dashboards that I have created for clients.
I am an SEO Consultant based in Lausanne. I work in French, German and English. My clients have one of these challenges:
- They want to target the french speaking market,
- They have a multilingual website and are active on an international level.
I also love a dashboard. For people who like working with data and playing with GoogleSheets and graphs, SEO is like a chocolate factory: there is a lot of data. But I have not always been in love with data-led decisions. Quite the contrary, young Isaline was preoccupied with language, words, and letters and did not see how impactful data would be in her job.
Data is a common language
One day I understood: Data is a common language. It confirms hypotheses, it provides directions. In a company, data speaks for decisions about budget and resources. For anyone working on a website, the metrics and kpi will be helpful for their job. My experience showed me that whatever my position, there comes a day when I would be asked about my impact in the company. Digital marketing is often not seen like a ‘compulsory’ investment like accounting would be. When budget cuts are to be made, managers often look at activities that are not deemed ‘compulsory’ however ‘necessary’ there are. For this reason, I started the habit of always keeping track of how I spend my time, my progress and ideally, match my activities with numeral data. Keeping tracks helps me be prepared for the unexpected, at least I am not in panic when I am asked to show results.
Data & SEO: each field their specific metrics
“SEO (Search Engine Optimization) is the set of practices and actions aimed at increasing a website’s organic traffic from search results. SEO is one of the most important and effective marketing channels for various types of businesses.” says Ahrefs Glossary. Generally speaking, SEO aims at making a brand visible in the search results at each step of the marketing funnel.
“SEO KPIs are metrics used to measure SEO performance. Typically, SEO KPIs track visibility or traffic and how it fares in relation to your goals.“(Search Engine Land).
There are three fields in SEO and each field of SEO uses its specific metrics:
- Technical SEO “ refers to optimising a website’s technical aspects that are responsible for crawling and indexing by search engines, as well as website performance.“ says Ahrefs Glossary. Technical SEO is interested in things such as Crawling, Indexation, Information Architecture, Tags (canonical, hrefs), Structured markup, etc.
- On Page SEO refers to “optimising pages on a website to improve their ranking in search engines.” says Ahrefs Glossary. On page SEO is interested in the content of the page, the textual page content but also the images, the links, the meta data.
- Off Page SEO refers to “actions taken outside of the website”. says Ahrefs Glossary. Off pages SEO contains Digital PR and Branding and is interested with back links and mentions.
How to choose the right metrics?
When you work in SEO, it is easy to have lots of data, it is more difficult to cleverly use them. The metrics should:
- be relevant to a company’s business goals,
- provide actionable insight.
Metrics differ according to hierarchy from an overview to a micro level. Some metrics are important but do not talk in the language of the business. Some metrics are relevant for the management, while other metrics are relevant for the specialist of a given field. As an SEO, I chose my metrics according to who I am speaking to:
- Who is going to look at them?
- How will it be used?
- What are you trying to know?
From experience, most questions start either with ‘Should we invest more in … ?’ or ‘Can we reduce the budget in …?’. Most of the time, the management wants more results – or at least the same level of results – for less money. One needs to be prepared to show how an action has worked and how it could work better.
Overviews or metrics for the C-Level – examples
For me, a metric for a C-Level is a metric that gives an overview and answers the right questions. Forget about the detailed technicalities, don’t try to make a director enthusiastic about indexation if you don’t link it with the expected visibility and revenue associated with it. If you really have to get a C-Level interested in a detail metric, a good tip is to compare the competition.
Checking the trends: is a website healthy?
The first thing I like to do on a website is checking the general trends which are the organic traffic and the visibility. In this case I look at the trends, it gives me an indication if the website is generally speaking healthy or if there is something to be worried about. I start by checking the traffic sources in Google Analytics.
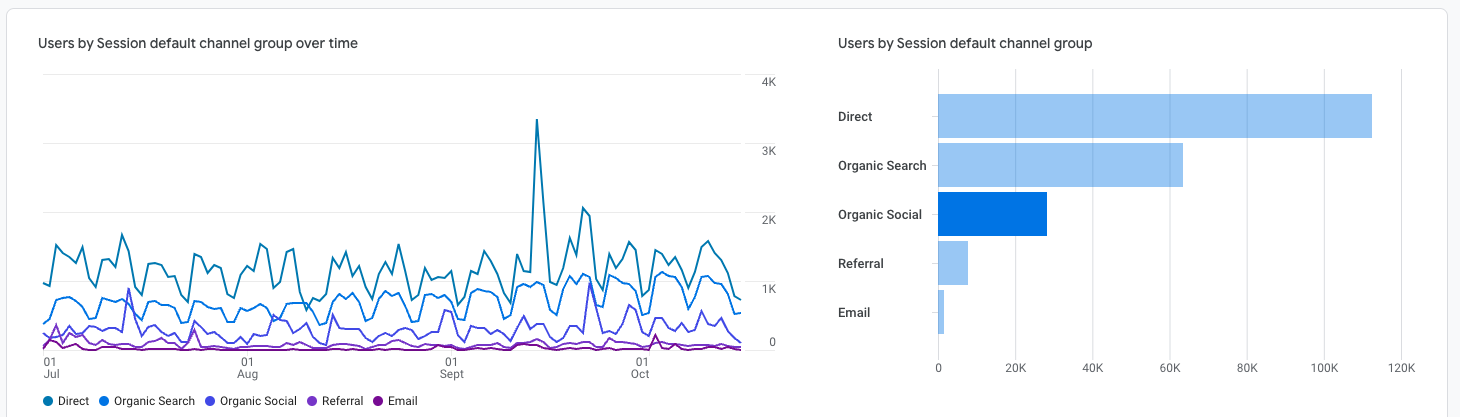
Image: This is a Google Analytics Standard Report print screen. The first graph shows the trends of users by session grouped over channel over time. The second graph tells me how important organic traffic is for a website.
Secondly I check the visibility trends in the Google Search Console in the Performance report. I check whether there is something looking wrong between the languages, the clicks and impressions. For example if one language performs a lot better than another or if there is a big gap between the impressions and the clicks.
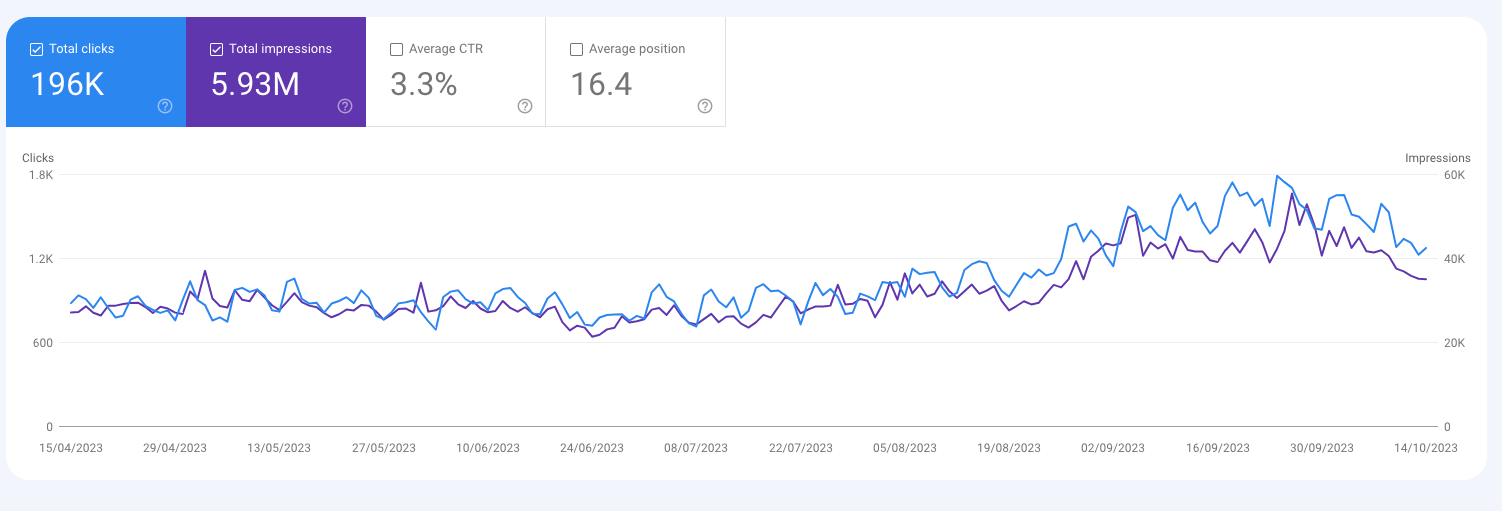
Image: This is a Google Search Console Performance report print screen. It shows the trends of the impressions and the clicks. If they go upwards, I would conclude that the company is creating content or optimising existing content.
Source, conversion and revenue report: e-commerce
This graph will give us a better understanding of the user journey. For example, the user first landed from organic, but converted from PPC. We need to analyse both:
- the first user acquisition channel (as on the example),
- what traffic source brought the conversion.
In e-commerce it is ‘relatively’ easy,compared to service based business, to link source, traffic and revenue.
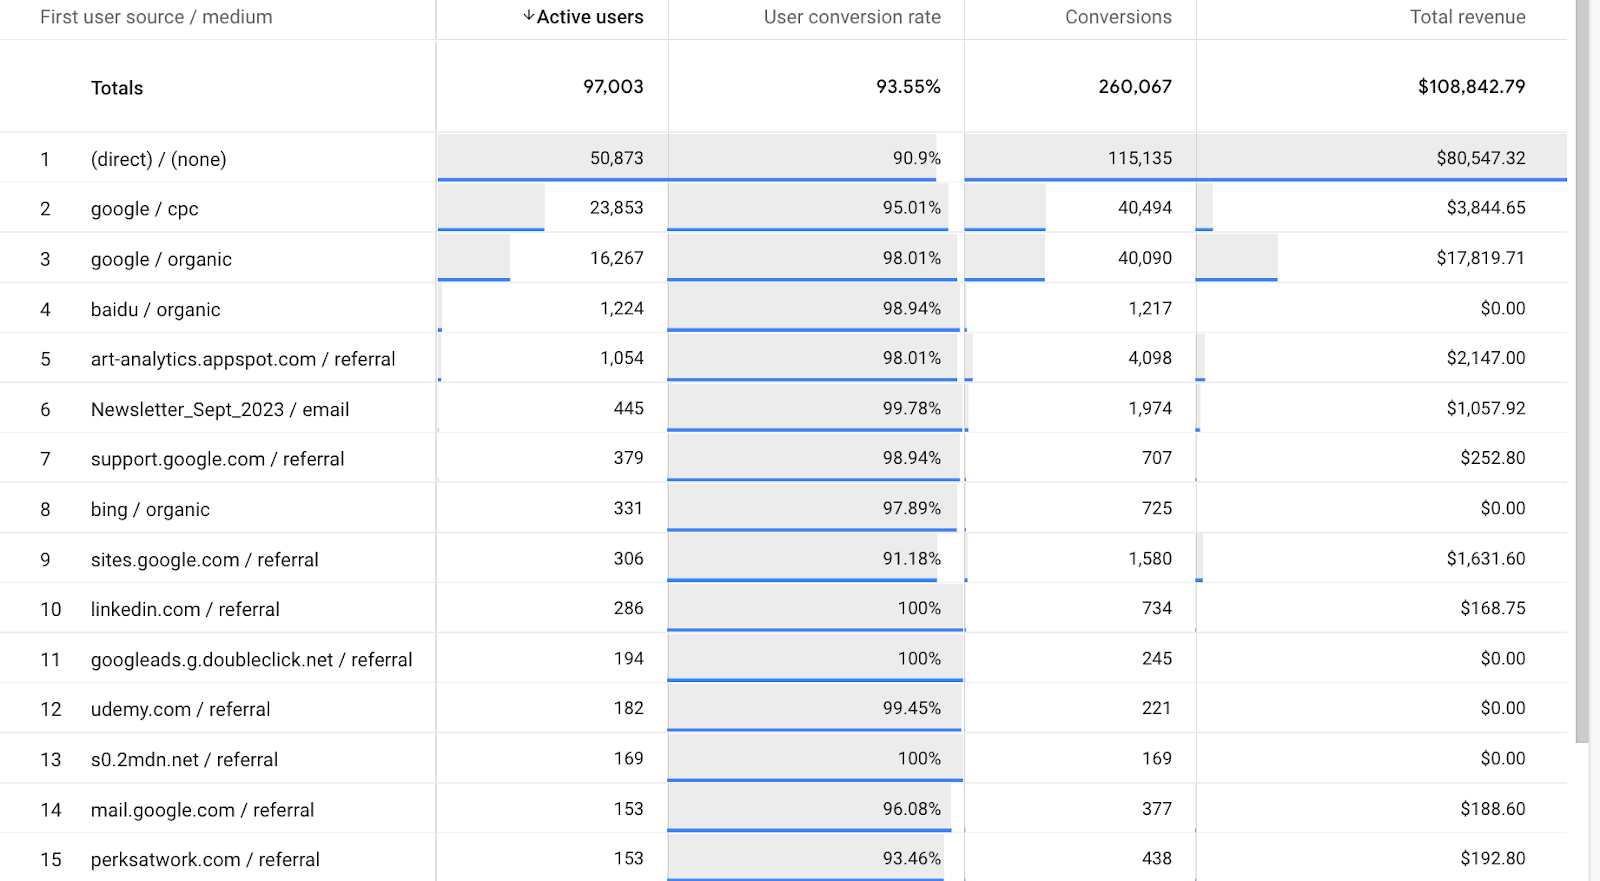
Image: This is a Google Analytics Exploration Report print screen. Explorations Reports are custom built. I built this one together with Irina Serdyukovskaya.
Service based business: does a website generate leads?
For services based business, the final conversion is generally a contact (which we call a lead). That contact can be a call, a contact form, a click on a website email address and a message sent. For this example, my client had published new niche B2B service pages. I wanted to suggest optimisation on the services pages to make contacting the team friendlier for the users. I wanted to show the gap (or abandonment rate) between the service page and the contact page. The funnel talked for investment, we switched the general contact form with a button ‘contact us’ to a ‘call me back’ CTA, added a clickable email, a clickable phone number and the picture of the person in charge of the service.
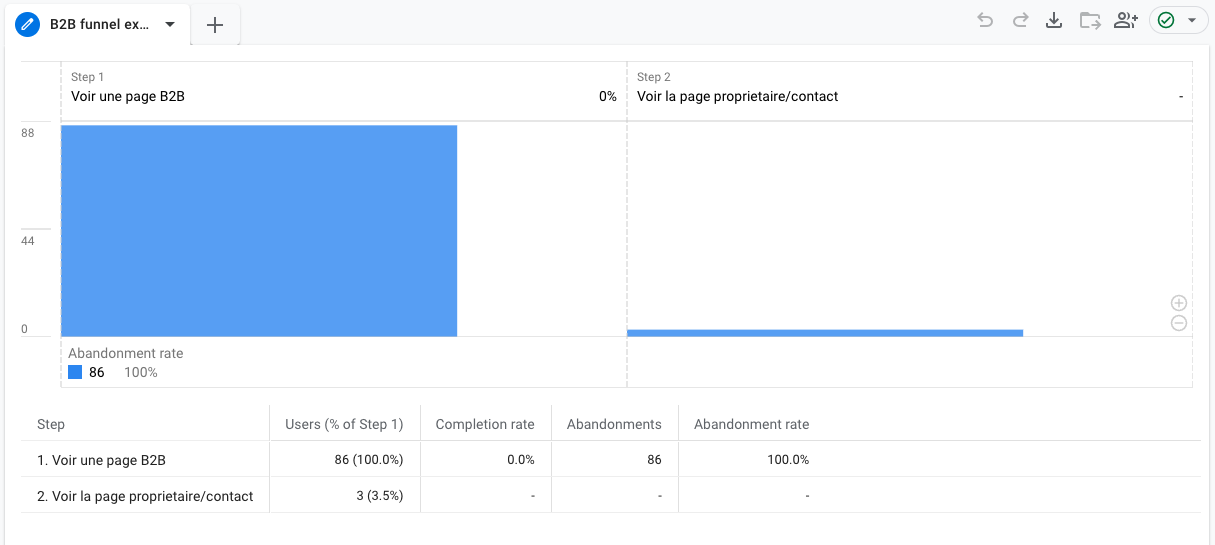
Image: This is a Google Analytics Exploration Report print screen. Explorations Reports are custom built. This particular funnel report includes only two steps. Most funnels will include more steps if the website includes a blog.
In a funnel report, it is possible to see:
- the conversion: how many users landed on the contact page → are the pages ‘losing opportunities’?
- from what type of pages the users initially came: blog / news / home page → do pages fulfil their expectations?
To show the SEO success, we might be interested to see whether the users are actually visiting the service page or the contact page after reading a blog article. A funnel report is useful to show if the website is converting the users to the next step. It speaks for changes on a given page, it can changes in textual content, visual designs.
Swiss university: is the topic worth further investment?
Our next example is from a Swiss University. Imagine a central media team, in charge of the branding of the university and press relations and several communication specialists attached to a department. Each specialist promotes the findings, events and publications of their department. It is up to the central media team to select the topic for which further resources will be invested, namely articles that will be translated into other languages and topics that will be promoted further for example with a press release, if it will be promoted internally or not at all.
The central media team wants to decide investment led by data. We created a dashboard for them to see which author (i.e. which department) and which article generated the most views and the most engagement (in this example engagement is defined by time spent on session.)
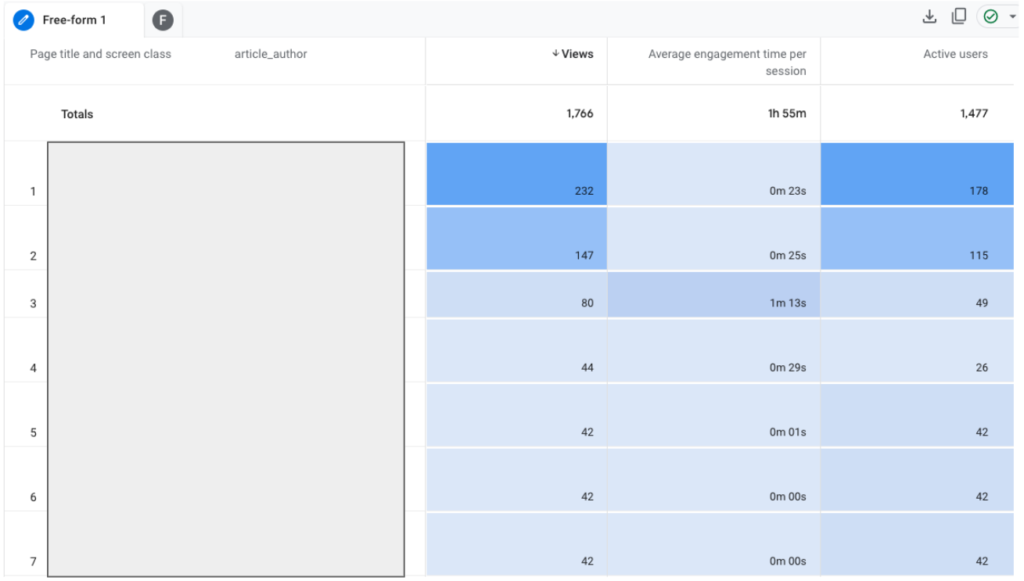
Image: This is a Google Analytics Exploration Report print screen. Explorations Reports are custom built. I built this one together with Irina Serdyukovskaya.
Overviews or metrics for the specialists – examples
Some metrics do not speak the language of the business. Taking them out of their context, they don’t provide insight on how well the website is performing for the business. However, for the specialists involved, they provide insights on what needs to be done and how well the activities are improving the website.
Technical SEO: Core Web Vitals scores
A typical example of a metrics that does not speak the language of the business is the core web vitals scores. This data, taken out of context, does not say anything about a business and it is not understandable for someone of is not a specialist. The context could be a comparison with the competition, or bounce rate. A slow website might deter users from navigating.
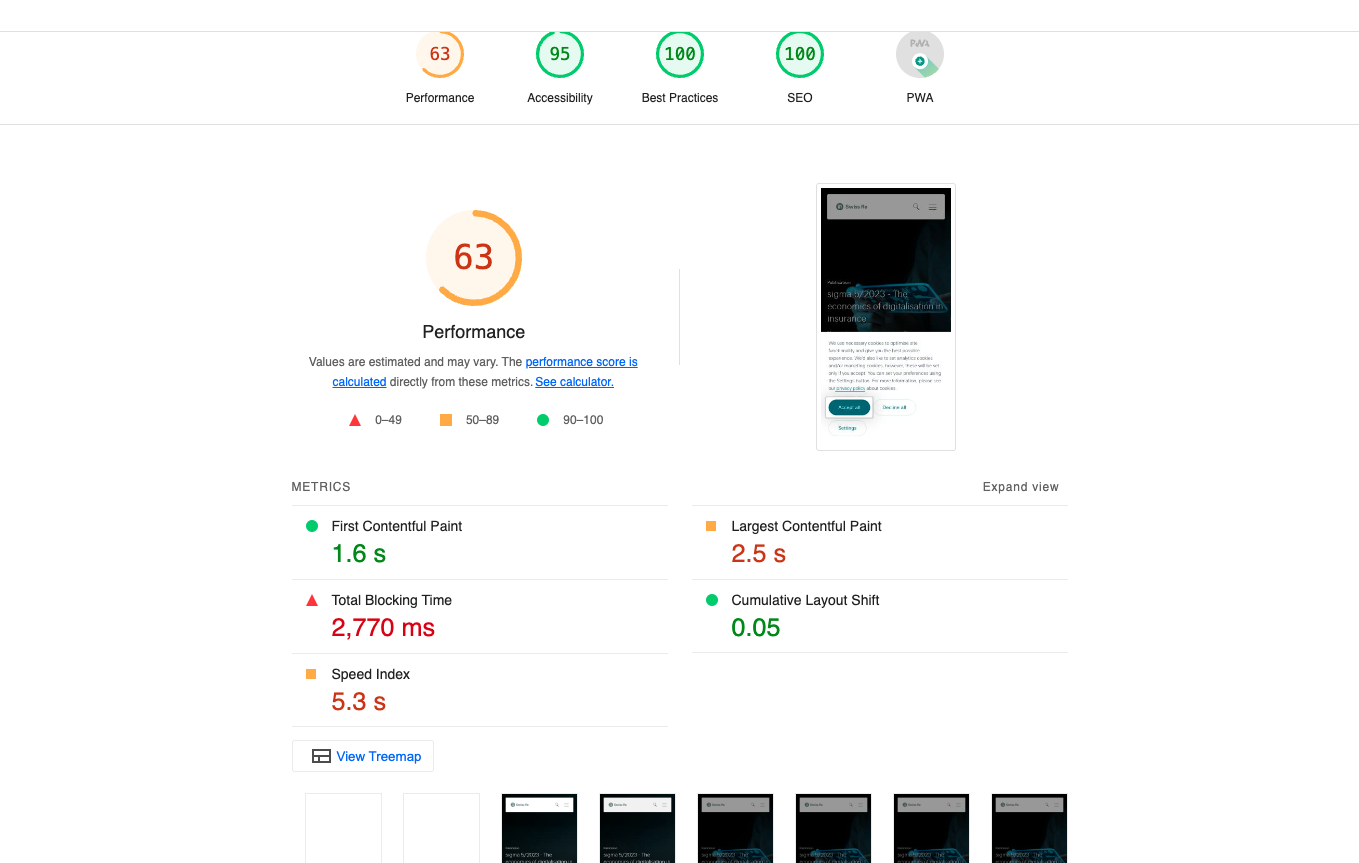
Image: This report is created using Google Chrome webmaster Tool: Lighthouse Report. See details of the report. Before deciding to improve the Largest Contentful Pain, the company should connect this metric with a business objective to make sure that the time invested is a worthy investment.
On page SEO: Search volume and keyword difficulty
Copywriters are familiar with search volume and keyword difficulty. These metrics do not speak the language of the business but they give actionable insight on the opportunity of a semantic field and the difficulty to be visible. I like to research further how do the SERPs look like and wether there are GoogleAds. Some keywords are lowly targeted in organic but there might be a lot of Ads, if that is the case, the organic results will be pushed down. This type of data answers questions such as: how high is the investment compared to the opportunity? Is it worth it for our company to invest in copywriting for this semantic field?
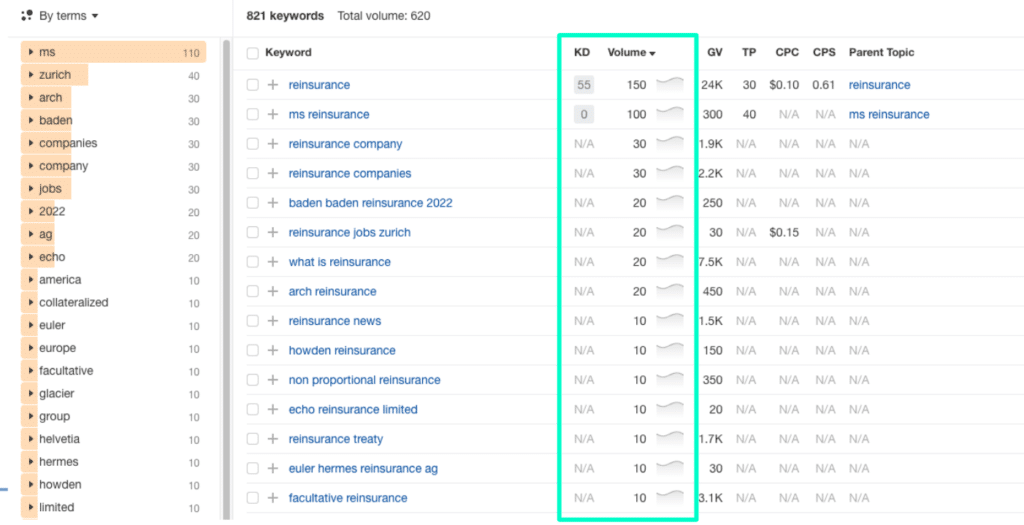
Image: This is an Ahrefs printscreen checking the matching terms for the keyword ‘reinsurance’.
On page SEO: Checking opportunities & the competition
When I do a keyword search, I like to check how well the website I am working for is faring for the list of keywords relevant to the business I have selected. I then export the organic keywords associated to the website of the competition to see how the market is doing. It gives additional insights of the opportunities and the work necessary to make the brand visible.
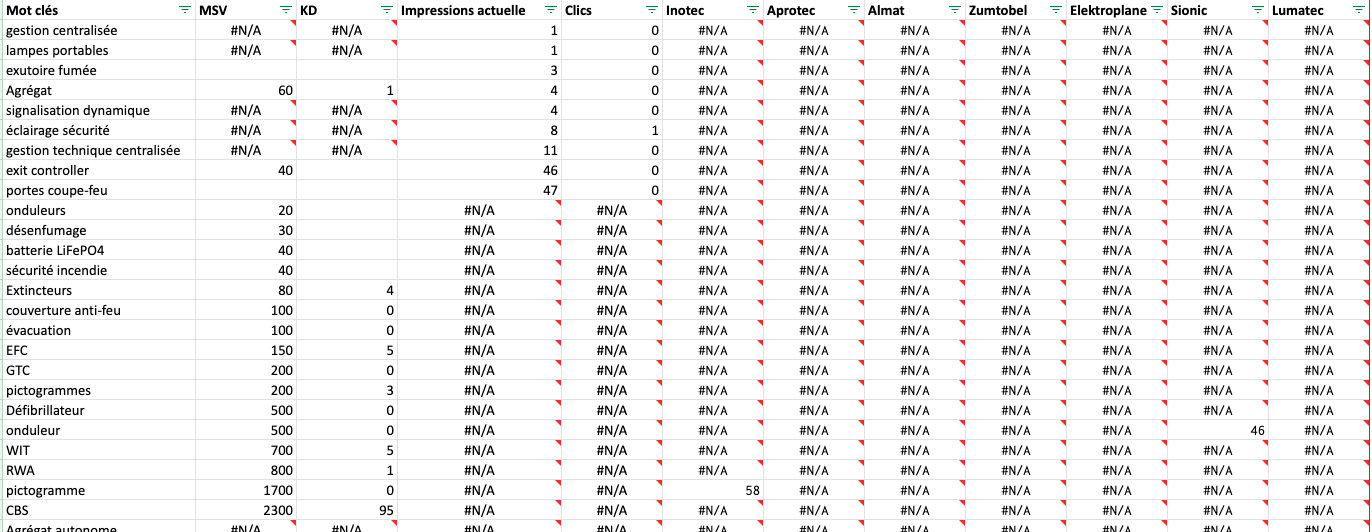
Image: Printscreen of a comparison with data from the GSC and data exported from Ahrefs.
On page SEO: Google Search Console: performance report per queries and per URL
When I want to check the performance of a given article or the performance of the website on a set of keyword, I use the Google Search Console. The performance report per URL is especially interesting for copywriters for them to check the quality of an article. It gives all the keywords the article is ranking for. The impressions data can be compared to the Monthly search volume of Ahrefs to see if the website captures all the opportunity. It answers questions such as: did Google correctly understand the keywords I was aiming at? Is the article understood for all keywords I was going for or can I optimise for further keywords.
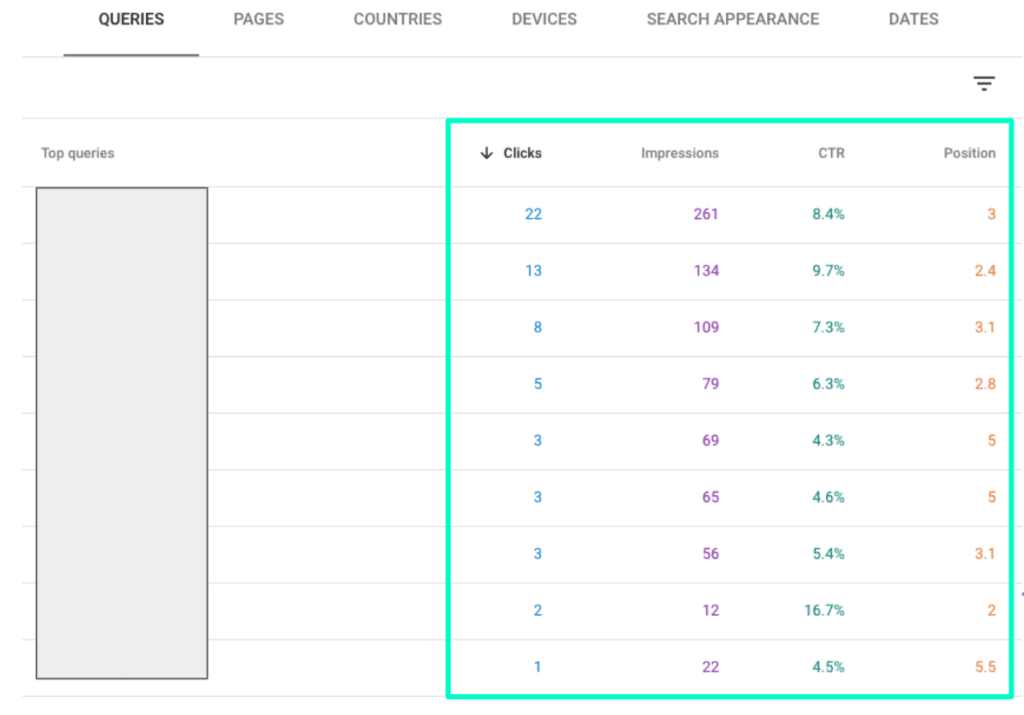
Image: Printscreen of the performance report for an URL. The queries and performance of queries for the URL are visible.
Off page SEO: Digital PR: mentions & backlinks
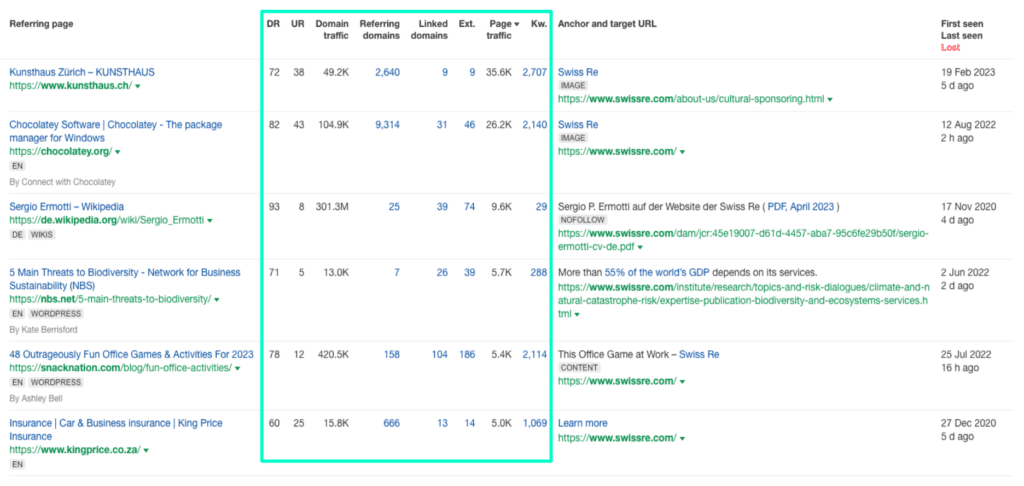
Image: Ahrefs printscreen about the backlinks and their quality of SwissRe’s website.
Off page SEO: Branding: knowledge panel
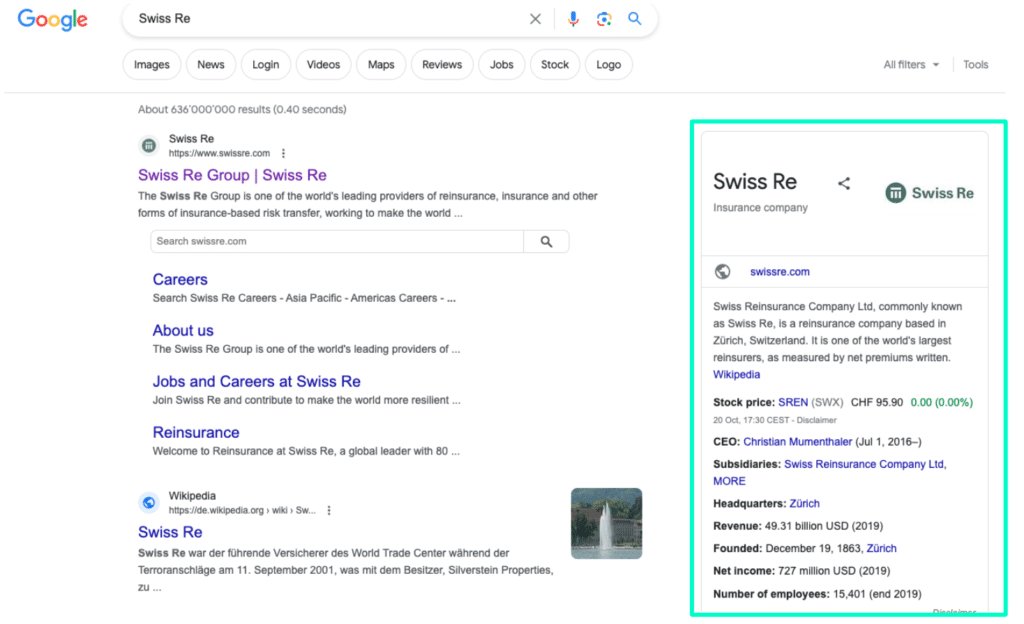
Image: This is a SERPs print screen for the brand name Swiss Re.
How to start tracking the metrics that will be useful and actionable for a company?
Magic happens when a brand knows the KPIs that matter for their growth.
How to get started?
- Understand your company’s goals
- Understand your company’s specific challenges
- Define your objectives (specialists)
- Choose your metrics and KPI: C-Level & specialists
- Create a reporting plan
Do you need help setting a tracking and reporting plan or creating dashboards?
Contact me: isaline@pilea.ch
I can create for you a tracking plan that is actionable and insightful.